
In recent days, probably from my learning to watch baseball games or from my reading of various books, I finally was able to crystallize into words some ideas that I long had about investing. These are qualitative ideas that are rooted in quantitative terms, such as “type I error,” “type II error,” “base rate,” and “hit rate.”
First, for the purpose of this article, let me define these terms:
- Type I error: False positive. You studied a bad stock and you concluded it is a good stock.
- Type II error: False negative. You studied a good stock and you concluded it is a bad stock.
- Base rate: Among all stocks, the percentage that are indeed good stocks.
- Hit rate: Among all stocks you concluded as good stocks, the percentage that are indeed good stocks.
Then, let us imagine an investor named Tom. Tom has a type I error rate of 25%, a type II error rate of 25% and the general stock market has a base rate of 25%. Tom sounds like a great investor: He only lets in ¼ of the bad stocks and he only misses out ¼ of the good stocks. What do you think Tom’s hit rate is — i.e., for all the stocks that Tom picked as “good” stocks, what is the percentage of these stocks that are indeed good stocks? 75% you think?
For the sake of simplicity, say Tom lives in a world with 100 stocks in total, consisting of 25 good stocks and 75 bad stocks (a base rate of 25%). Among the 25 good stocks, Tom picks 18.75 stocks as “good” stocks (a type II error rate of 25%). Among the 75 bad stocks, Tom picks 18.75 stocks as “good” stocks (a type I error rate of 25%). So, after studying all these 100 stocks, Tom identifies 37.5 stocks (18.75 + 18.75) as “good” stocks. But, only 18.75 of these 37.5 “good” stocks are true good stocks. Wait. Check the math again. You are right. Tom’s hit rate is only 50% — only half of what Tom thinks are “good” stocks are indeed good stocks.
Wait a second. What does a 50% hit rate mean? “50% hit rate” means Tom’s ability to pick stocks is no better than… coin flipping!
But, didn’t we just agree that Tom is a good investor?
Brutal!
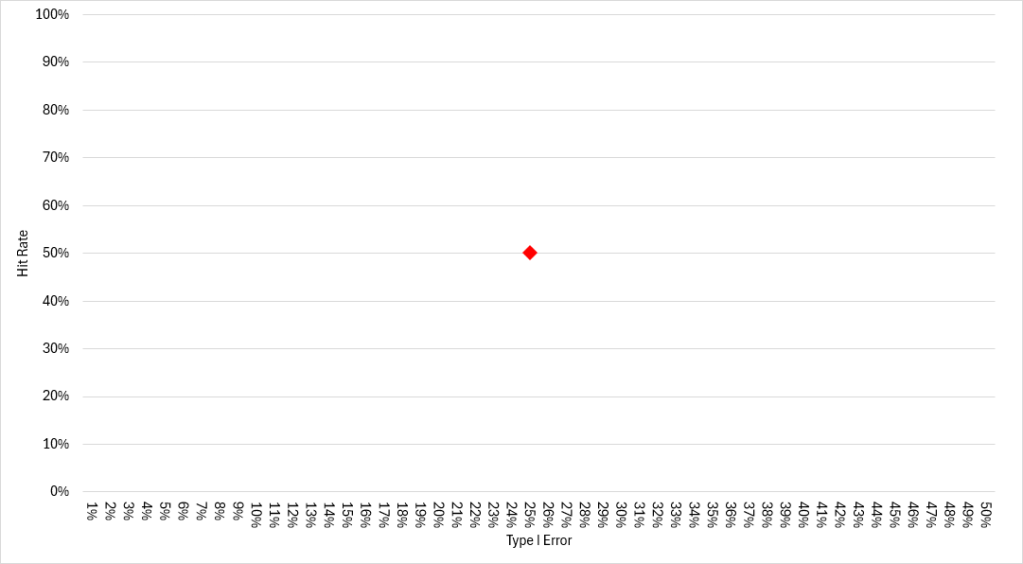
Let us take a quick pause and try to visualize Tom’s performance using the following graph. The X-Axis represents “type I error rate.” The Y-Axis represents “hit rate.”
So, the red dot you see on the chart represents Tom’s profile: He has a type I error rate of 25% (the X-Axis) and he delivers a hit rate of 50% (the Y-Axis).
Note: Tom has a type II error rate of 25% and he operates in a world with a base rate of 25%. These two measurements are not shown on the chart.
Using this chart as a mental framework, I argue, we can extract some qualitative lessons — and they happen to be of paramount importance to successful investing.
Lesson #1: Type I Error (Not Type II Error) Is The Name Of The Game
Let us look at Tom again. Tom is not satisfied by his hit rate that is currently at 50%. So, he faces a choice: If he is going to choose only one area to improve, should he improve his type I error rate or type II error rate? What do you think?
As a reminder, type I error is “false positive” (mis-identify a bad stock as a good stock) and type II error is “false negative” (mis-identify a good stock as a bad stock).
Let us hypothesize some scenarios:
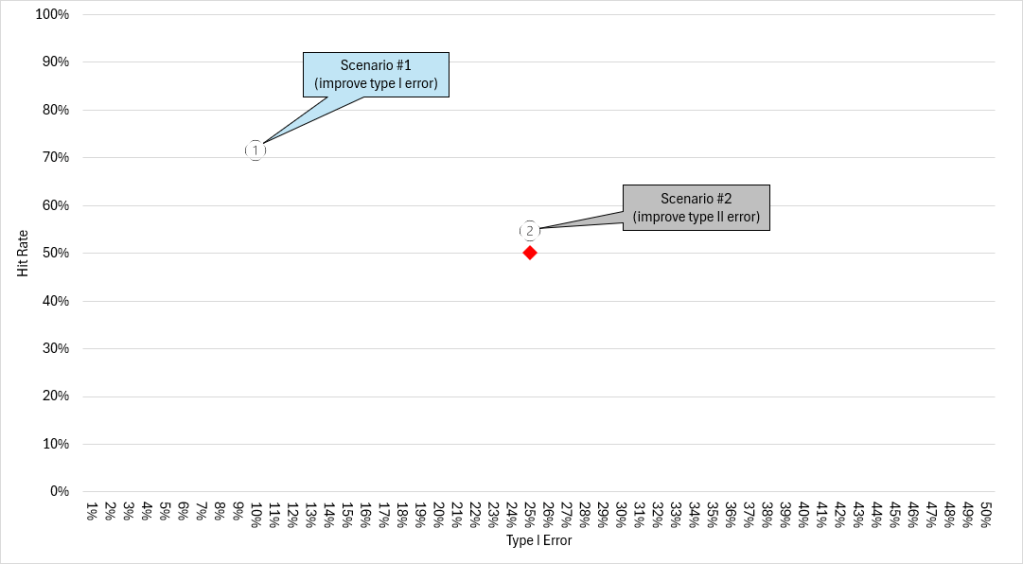
- Scenario #1: If Tom reduces his type I error rate from 25% to 10% (leaving type II error rate at 25%), Tom’s hit rate will increase from 50% to 71% — an improvement of 21 ppt.
- Scenario #2: If Tom reduces his type II error rate from 25% to 10% (leaving type I error rate at 25%), Tom’s hit rate will increase from 50% to 55% — an improvement of 5 ppt.
See below. The red dot still represents Tom, before improvements. The two improvement scenarios are marked by two “circled numbers” on the chart — to make it easy to read, they are accompanied by colored callout boxes.
It is obvious: It is the improvement in type I error that makes the biggest difference. Improving type II error does not make nearly as big a difference on hit rate. If he faces a choice, Tom should focus on improving his type I error.
To generalize it, in investing, investors should prioritize improving their type I error and can feel safe to de-prioritize improving their type II error.
To put it another way, investors should be exceedingly discerning in what they allow into their portfolios. At the same time, investors should be fairly tolerant of missing great investment opportunities — tell yourself, that is okay!
Before we move on, a quick note on the chart. Since changes in type II error rate have minor influence on hit rate, the rest of the article will focus on changes in type I error rate. Thus, type II error rate will be held constant at 25% for all charts that are shown.
Lesson #2: Active Investing Is An Extremely Low-Chance Game
Tom can only deliver a hit rate of 50% (before any of the hypothetical improvements). That is brutal. What is more brutal is the very reality that investors are dealing with. Hear me out.
On the investor side, most observers probably would agree that a skill level of “a 25% type I error rate and a 25% type II error rate” is a high bar already. Most of the time, when investors are presented with an investment opportunity, it is extremely difficult to tell whether it is a good investment or not. For example, a high-growth stock (the company is growing fast but the stock is expensive; should I buy it?), a deep-value stock (the company has some problems but the stock is cheap; should I buy it?), a “turnaround” stock (the company is struggling and it recently appointed a new CEO; should I buy it?), so on and so forth. It is terribly difficult to tell.
Most situations are not easily “analyzable.” Most investors are nowhere near being prescient. So, if I had to speculate, I would say that for most investors, their type I error rate and type II error rate both are in the range of 40% to 50% — probably, slightly better than flipping a coin.
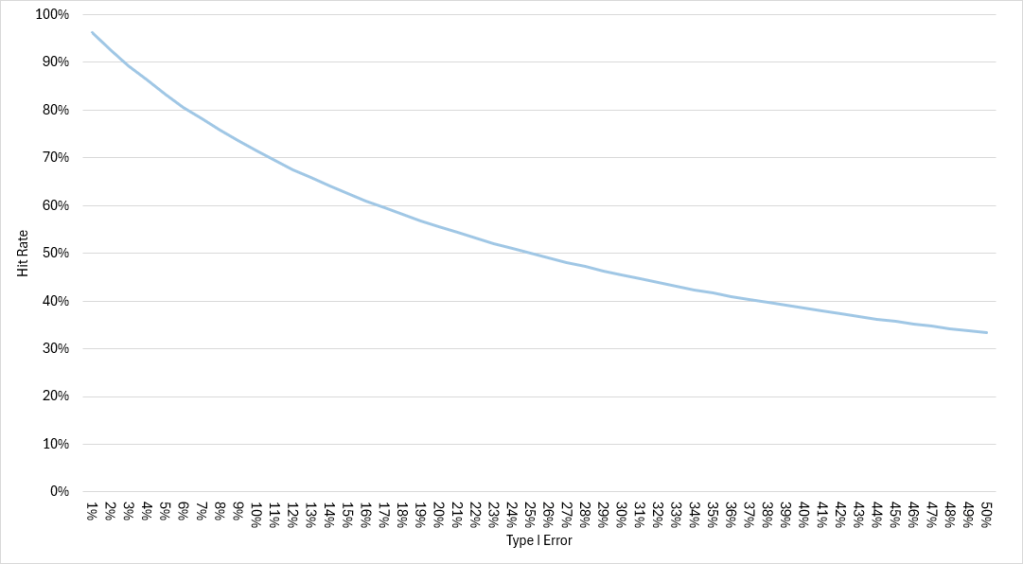
We already know that type I error is the important one. So, let us focus on type I error. If we were to chart a continuous series of type I error rates and their associated hit rates, we can create the line on the chart below.
Remember, we assume type II error rate fixed at 25% (an optimistic assumption already). Also, the base rate is set at 25% for now.
As the chart shows, the lower the type I error rate is, the higher the hit rate is. Now, locate the “40%” mark on the X-Axis and find the corresponding value on the Y-Axis — a hit rate of 38%! Repeat: If Tom’s type I error rate is 40% (instead of 25%), his hit rate drops from 50% (coin flipping) to 38%! That is worse than coin flipping, meaning if we stand next to Tom and watch him pick stocks, we are watching someone who is making wrong decisions most of the time!
So, that is on the investor side. On the side of the stock market, a “25% base rate” also sounds high. Professor Hendrik Bessembinder of Arizona State University has shown (link) that over the past century, the top 4% of stocks generated the entirety of the U.S. stock market gains and the remaining 96% of stocks were a wash; nearly 60% of all stocks generated lifetime returns that were lower than Treasury bills; the single most likely outcome for all stocks is for that stock to go to zero (i.e., a total capital loss). Depending on how an investor defines a stock to be “good,” the base rate is probably somewhere between 4% (finding the next mega-cap stock) and 25% (finding the next average good stock), with a tilt toward the 4% end.
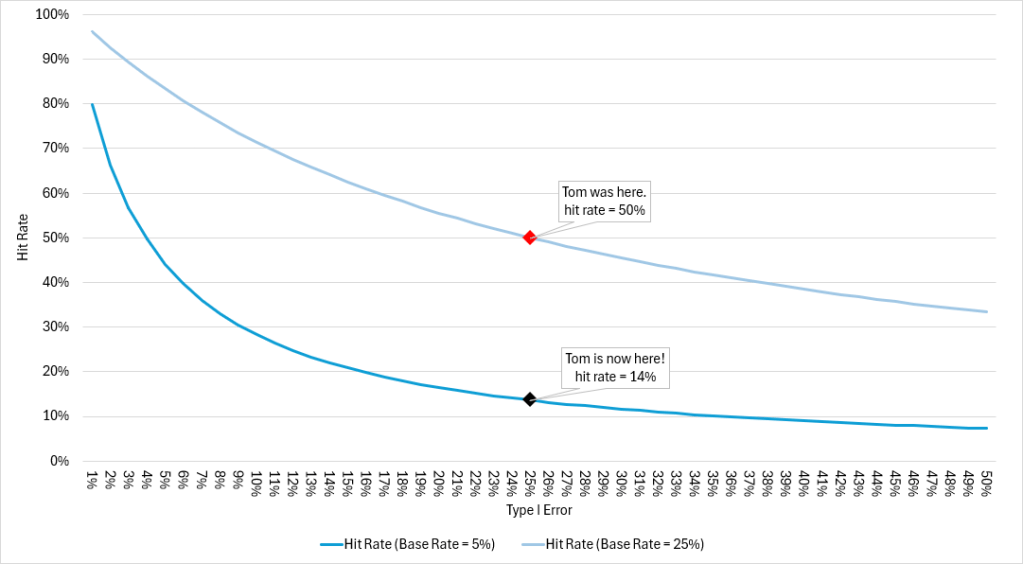
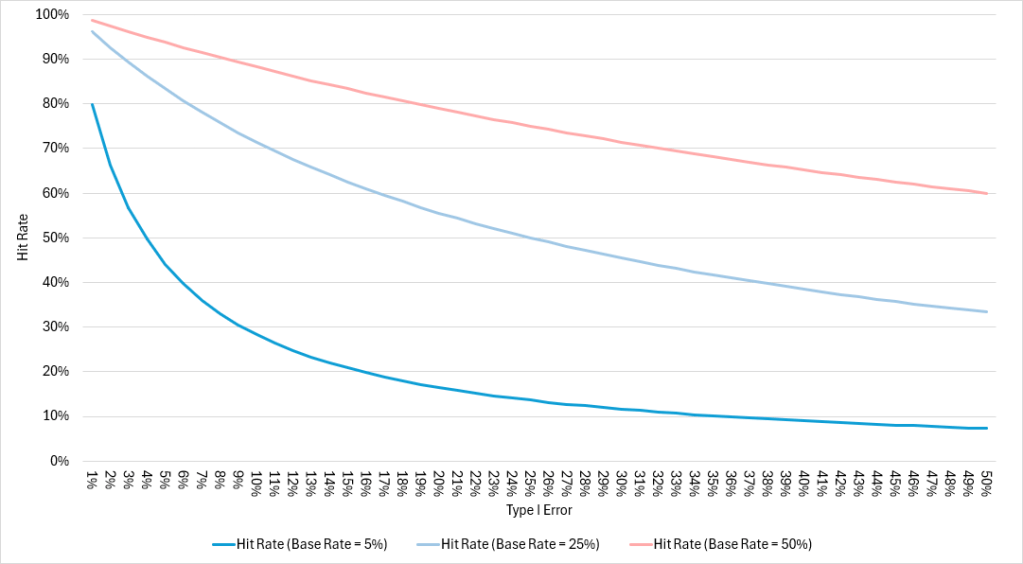
To illustrate the “power” of a different base rate, see the chart below. There are two curves: The dark blue line has a base rate of 5% (to reflect Professor Bessembinder’s 4% base rate world; “rounding up” 4% to 5%); The light blue line has a base rate of 25% (the line we originally saw, to reflect Tom’s world of 25% base rate).
Think about it:
- Say, poor Tom wakes up one day and realizes that he is no longer in that 25% base rate world. Instead, he is in a new and more realistic world of 5% base rate. In essence, Tom moves from the light blue line to the dark blue line. Assuming Tom maintains his 25% rates for both type I error and type II error (he didn’t lose any skill during that night of sleep), Tom’s hit rate will collapse from 50% (the red dot on the chart) to 14% (the black dot)! For every seven stocks that Tom picks as good stocks, six of the seven are going to be bad stocks!
- In a 5% base rate world (the dark blue line), in order for Tom to push his hit rate back to 50%, Tom has to improve his type I error rate from 25% to under 4% (move along the X-Axis from 25% to the left of 4% mark). What does a 4% type I error rate mean? It means Tom is allowed to make only one mistake for every 25 bad stocks that are presented to him — and he has to perform on this high level on a consistent basis throughout his investment career. That is quite a lot to ask from any investor.
How many investors can consistently deliver a type I error rate of 25%? Very few I guess. How many can consistently deliver a type I error rate of 4%? We are probably looking for unicorns.
Even if we are lucky enough to find such a unicorn investor, his or her hit rate is still just at 50%. His or her ability to pick a good stock is equivalent to you flipping a coin while reading my blog now!
An investor has to be much, much better than what we have imagined so far in order to achieve a hit rate that is above 50%.
And, much, much better, again, to have a chance to eventually outperform the stock market on a sustainable basis.
We are looking for a “super unicorn” with a horn of gold!
Lesson #3: “Perceived” Base Rate and “Perceived” Hit Rate Lead Investors Astray
Prospect Theory, developed by Daniel Kahneman and Amos Tversky, introduced the idea that people tend to assign excessive weight to events with low probabilities. For example, people might perceive a 1% chance of winning as more likely than it is. It is irrational and it appears to be systematic in how humans perceive probabilities.
In investing, this form of systematic bias is prevalent. On one level, most investors are shocked when they first learn that only 4% of stocks generated all the gains for the entire stock market — they think it is something much higher, like 30% or 50%. Also, most investors are surprised when they learn that the single most likely outcome for any stocks is for that stock to go to zero — I have personally invited people to guess the most likely outcome and most of them could not believe it is “stocks to go to zero.”
On another level, most investors tend to have a self-perception that they are skillful at picking stocks. During client meetings, fund managers confidently make a long list of predictions — yet, remember, almost all active managers have failed to deliver a return that can match the S&P 500, year after year, decade after decade. On Reddit’s “r/wallstreetbets” online forum, it reads like everyone is “in the know” about precisely what stocks will go up tomorrow — but ask yourself, how many retail investors you personally know are able to generate superior investment results on a consistent basis for a long period of time?
So, I argue, in investing, most investors mis-perceive probabilities, not once, but twice! First, the base rate of the stock market (“how many fish are in the pond”). Second, the hit rate of the investor himself (“how good are we at fishing”).
See the red line in the chart below. The red line represents a base rate of 50%.
For most investors, they probably truly believe that they live in a world of a 50% base rate (the red line) with themselves achieving an extremely high hit rate (high on the Y-Axis).
The combination of (mis-)perceiving a high base rate and (mis-)perceiving a high hit rate causes an investor to conclude that “This is easy,” “I can do this,” “This investment opportunity is the real deal.” Clicking the buy and sell buttons on a smartphone is also easy. Thus, the investor becomes “trigger happy.” He starts to make frequent investment decisions, stuffing his portfolio with a large number of stocks — all without knowing that he doesn’t live on the red line, but he lives near that dark blue line; and, his true hit rate is materially smaller than he thinks he possesses.
Double mis-perception hurts.
Lesson #4: If Self-Improvement Is Too Difficult, Improve Your Environment
I have increasingly come to hold a view that, in investing, self-improvement is hard, extremely hard. Successful investing demands some qualities in an individual that do not improve easily: good temperament, good judgment, being prescient, the ability to transcend and to “see.” It is not only about the ability to churn out spreadsheets and to write investment memos — which, honestly, a lot of people can do.
There are plenty of prestigious universities with prestigious investment training programs — but, we do not see any institution that has a demonstrated history of producing on a systematic basis a large number of superb investors with superb long-term investment track records.
Personally, let us ask ourselves this: How often do we see an adult change himself or herself from “having a bad temperament” to “having a good temperament,” from “not insightful and not prescient” to “superiorly insightful and godly prescient”? It usually doesn’t happen.
People can self-improve in most activities, such as becoming a better chef, a better driver, a better anything (insert a role you have in your mind here). But to self-improve as an investor seems to be pretty hard. Put it into the context of this discussion, quite possibly, it is extraordinarily hard for an investor to improve his or her “type I error rate” and “type II error rate.”
So, that brings us to an insight. In investing, if improving type I error rate and type II error rate is too difficult, investors should focus on improving their “base rate.”
For a fisherman who wants to catch more fish, instead of putting a lot of effort honing his fishing skills at a pond with few fish, he should pack up and move to a better pond!
For investors, they may want to consider investing in another sector or in another country.
As seen on the last chart I drew, to choose a better base rate is to “jump” from a lower curve to a higher curve. With the same type I and type II error rates, one is guaranteed to get a drastically better hit rate. It is just math.
No wonder U.S. stocks are loved by investors around the world. It is one of the best “ponds” in the world!
Concluding Thoughts
A type I error is you pulled the trigger when you shouldn’t have. Buy the wrong stocks and lose money. It is associated with “overconfidence.” A type II error is you didn’t pull the trigger when you should have. Reject a great stock, only to watch its price go up and up. It is associated with “FOMO” feelings. Base rate describes the environment you are in; sometimes you can choose the environment and sometimes you cannot.
Many of the teachings by the greatest investors can be interpreted as advising people to choose their “base rate” wisely and to improve their “type I error” diligently, while to develop the capacity to tolerate “type II error.”
Much of what average investors are doing can be seen as being delusional about “base rate,” being blind to “type I error,” while being paranoid about “type II error.”
Paranoid about type II error?! Warren Buffett once described this kind of paranoia well, “You can’t stand to see your neighbor getting rich. You know you’re smarter than he is, but he’s doing all these [crazy] things and getting rich … so pretty soon you start doing it.”
Uniting all the lessons here in this article, I propose this final idea:
For successful active investing, one should be as “deliberately positioned” as possible (improve base rate), as “aggressively picky” as possible (improve type I error). At the same time, one should be as “patiently tolerant” as possible (tolerate type II error, tolerate “FOMO” feelings).
What a quirky combination of somewhat opposite mental qualities.
Yin and Yang, same time, in one body.
It is close to asking for the impossible.
This is why active investing is so hard.
(END)
