
Financial pundits like to make predictions like “when XYZ happens, the stock market will go up 80% of the time.” Those predictions are particularly common around the start of a new year, when people are eager to know how the year could possibly unfold for them. Seeing so many predictions, I become curious about their validity. So, I did some digging into the historical patterns of stock markets. The following is what I found.
U.S. Stock Indexes Go Up In Almost 80% Of Years
The U.S. stock market has one of the longest histories and one of the best performance records. The Dow Jones Industrial Average can be traced back to some 130 years ago and the S&P 500 has a continuous record of nearly 100 years. And the long-term performance record of U.S. stock indexes has been superb.
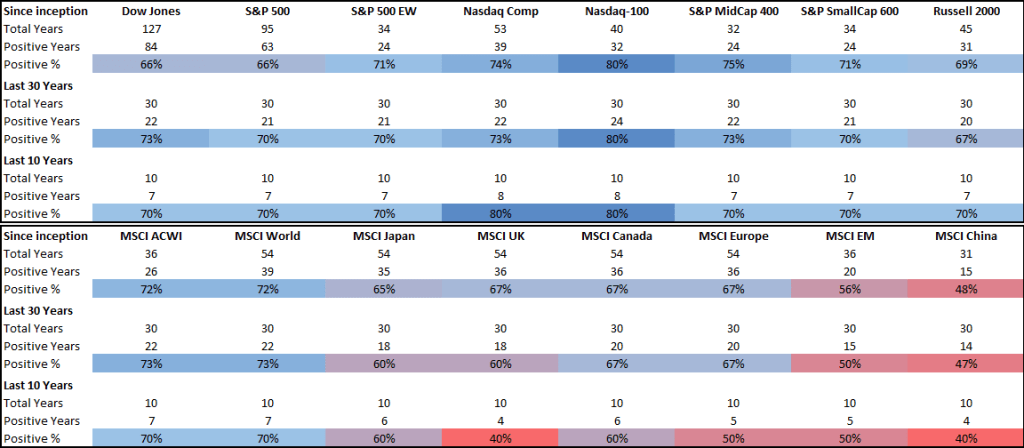
For ease of measurement and presentation, I measure index performance in calendar years, before dividends and all in US dollars. I built the table below. The upper half of the table displays U.S. stock indexes and their performance records and the lower half of the table displays global stock indexes and their performance records. Several observations stand out:
- On average, U.S. stock indexes are up in 70-80% of years, regardless of market cap categorization and regardless of being technology-focused or not.
- U.S. technology indexes performed meaningfully better than other U.S. indexes. For example, the Nasdaq-100 goes up in 80% of years.
- The closer to today the observed time period is, the better the index performance is. Last 10 years’ performance is better than that of the last 30 years, which is better than that of the entire history.
- Overall, the performance patterns of all measured U.S. indexes have been remarkably stable throughout history. The pattern of the past 10 years is similar to that of the past 30 years, which is similar to that of the entire history.
Outside of the U.S., performance records of key indexes differ. The MSCI ACWI Index and the MSCI World Index are both dominated by U.S. stocks, so it is not surprising that they are up in some 70% of years historically, just like U.S. indexes. But, individual countries and regions display patterns that are quite different:
- Almost all non-U.S. markets saw their index performance records deteriorate throughout time. The most notable examples are the UK and China, both of which saw more negative years than positive years in the most recent decade than in their own older histories.
- As a whole, the MSCI EM Index goes up in 50% of years — which basically means the pattern of emerging markets stock performance is no pattern!
Most Stocks Do Not Make Money
This somewhat counter-intuitive finding has been established by Professor Hendrik Bessembinder of Arizona State University through a series of papers (link) that he published over the past several years. His works cover the entire U.S. stock market from 1926 to 2016 (in total nearly 26,000 U.S. stocks) and some 30 years of global stock market history (in total nearly 62,000 stocks across 42 countries). Professor Bessembinder showed that over the past century, nearly 60% of all U.S. stocks generated a lifetime return that was lower than same-period Treasury bills; the top 4% of stocks made up the entire gains of the U.S. stock market and the remaining 96% of stocks were a wash. Outside of the U.S., the pattern is generally similar.
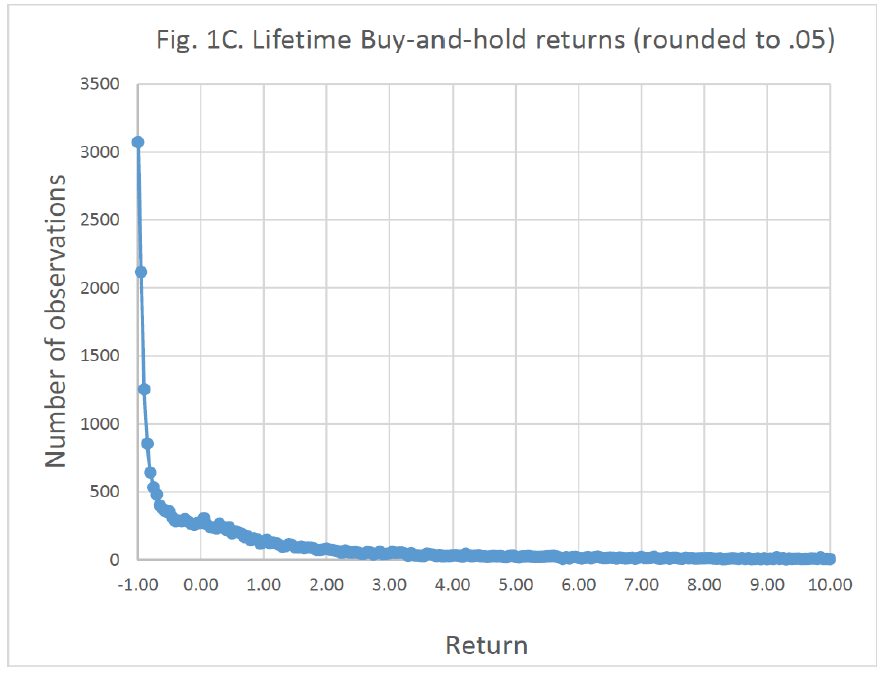
My favorite chart from Professor Bessembinder’s research is the following one. It comes from his 2018 paper (link). The chart, again, covers the entire U.S. stock market from 1926 to 2016 (nearly 26,000 stocks). The chart shows that for investors who buy-and-hold a U.S. stock, the most likely outcome is for that investment to go to zero! The next likely outcome is to go down by 90%, then by 80%, and so on and so forth. For non-U.S. stocks, the pattern is similar and can be found in a 2019 paper (link) authored by Professor Bessembinder.
Therefore, it is sensible to say that stock indexes tend to go up over time, particularly U.S. stock indexes, but most stocks — both U.S. and non-U.S. — tend to go down over time.
What Does It All Mean?
The above observations have profound implications for investors. I think we can draw at least the following insights:
Consider “base rates”: Psychologist Paul Meehl (a former president of the American Psychological Association) has written in 1954 (yes, 70 years ago; link) that the neglect of the base rates of outcomes can lead to inferior judgements. What are the “base rates” we should consider here? The U.S. stock market goes up in almost 80% of years. So, the next time you hear a financial pundit claim “when XYZ happens, the stock market will go up 80% of the time” — just tell yourself, the U.S. stock market goes up almost 80% of the time anyway! Think about it. So-called “experts” who constantly ignore base rates will constantly produce inferior judgements!
Unpredictability gives birth to overconfidence: Given that most stocks go down over time and so few stocks can yield superior returns over the long run — and picking winners successfully ahead of time and doing so on a consistent basis have been proven to be an extraordinarily difficult combination — the few investors who have had a winning streak will be vulnerable to overconfidence, thinking they are more skillful than they truly are. In a 2009 paper (link) authored by psychologists Daniel Kahneman and Gary Klein (the former being a Nobel Prize laureate), the two disagreed on many subjects but agreed that, and I quote their paper directly: “…individuals will sometimes make judgments and decisions that are successful by chance. These ‘lucky’ individuals will be susceptible to an illusion of skill and to overconfidence. The financial industry is a rich source of examples.” This world-renowned duo did not forget to call out “the financial industry” by its name!
For almost everyone, they should invest via index funds: It is an established fact that over the long term, stocks that can do spectacularly well are few. Over the long term, investors who can do spectacularly well are even fewer. Index funds, however, have outperformed almost all stocks and all investors year after year, decades after decades. Why should investors who like to think themselves as rational actors not invest via index funds?
For the few who still want to try, they should make fewer bets: For investors who still want to try (i.e., try to beat the index over the long run), given the historical data that I laid out above, a sensible approach is the following: Make fewer bets.
How many? Not too many! The late Charlie Munger, at age of 95, said in an interview (link) and I quote him directly: “basically, the Mungers have three stocks [in the portfolio]… Three things! I’m well along in my 95th year. Three things. You don’t need to own a lot of different things to get rich.”
(END)
