
The Social Mobility of Stock Markets
— A Historical Perspective into the U.S. and Chinese Stock Markets
My previous piece A Decade of Inequality focused on the concept of “market cap gains.” It reviewed the end results but paid little attention to how we got there — how did it happen that almost all the market cap gains were concentrated with the largest companies? Was it because larger companies started bigger so their gains over a decade’s time naturally became bigger? Or was it because smaller companies collectively never had a chance to grow big at all?
To put it differently, the question that my previous piece raised and that I am trying to answer in this piece is this: over the past few decades, have stock markets in the U.S. and China offered “social mobility” so that smaller companies can still achieve above-average returns relative to their larger peers?
My belief is that, over the past few decades, the U.S. stock market has transformed from a socially mobile market to a socially immobile market. Bigger companies keep getting bigger. Middle companies get stuck in the middle. Smaller companies cannot escape the fate of being small. Because of the lack of social mobility, active investing in the U.S. is becoming harder and harder. Also, I believe the reverse is happening in China where there is still social mobility among stocks: small companies can still grow big and the dispersion of stock returns is still wide. Therefore, China is still a market that rewards active investing much more than the U.S.
The methodology and scope of data for this study can be found in the end note section.
So, let’s see what data says.
How To Read The Charts?
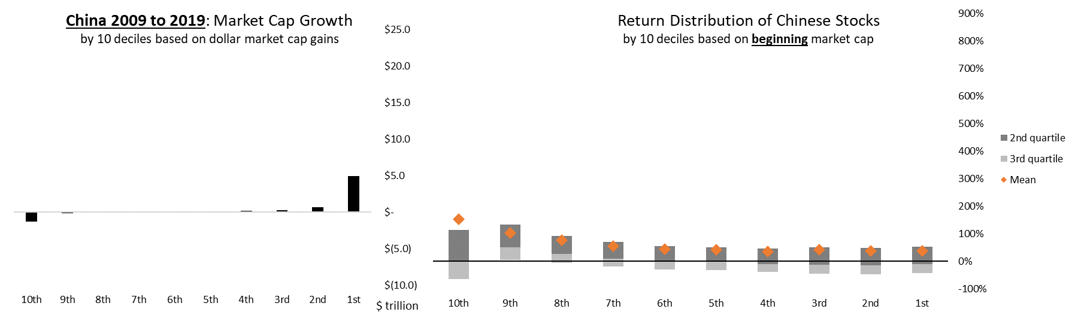
The bar charts on the left show the concentration patterns of market cap gains during the decade. Stocks are sorted into 10 deciles by the dollar size of their market cap gains over the decade. Each decile has about the same number of stocks. Each decile is represented by a bar and the height of the bar represents the total dollar market cap gains (or losses) of companies within that decile. The 10% of companies that gained the most market cap form the far-right bar in the bar chart; they are the 1st decile. The 10% of companies that gained the least or lost the most market cap form the far-left bar in the bar chart; they are the 10th decile. The Y-axis unit is in trillion U.S. dollars.
The box plot charts on the right show the distribution patterns of stocks’ cumulative 10-year returns. Stocks are sorted into 10 deciles according to their market caps at the beginning of the decade (or at IPO, if they went public during the decade). Again, each decile has about the same number of stocks. The largest 10% of the companies, based on their market cap at the beginning of the decade, form the far-right “box,” indicating they were the 1st decile largest companies at the start of the decade. Likewise, the smallest 10% of the companies at the beginning of the decade become the “10th” decile “box” that sits at the far-left side of the box plot chart.
The dark grey area of a “box” represents the 2nd quartile stocks and the range of their returns; the light grey area of a “box” represents the 3rd quartile stocks and their range of returns. Similarly, the top edge of a “box” marks the decile’s 1st quartile return; the bottom edge of a “box” marks the decile’s 3rd quartile return. The amber-colored diamonds represent the average (i.e. mean) returns of each of the deciles.
For ease of comparison, across all charts in this article, the scales of their Y-axes are fixed.
Decade: 1989 to 1999
Universe captured: ~8,900 listed American companies and ~1,100 listed Chinese companies
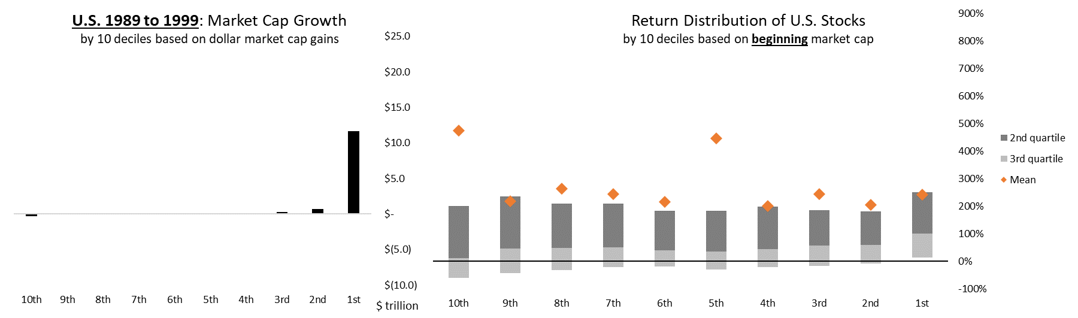
For the period from 1989 to 1999, the U.S. saw its equity markets increase fourfold in size, from $4.0 trillion to $16.5 trillion. By market cap gains, the top two decile companies (i.e., the far-right two black bars in the left-hand bar chart) contributed almost all the decade’s $12.5 trillion gains. The top five gainers were Microsoft, General Electric, Cisco Systems, Walmart and Intel. The bottom decile companies (i.e., the far-left black bar in the bar chart) lost $291 billion.
Regarding the return distribution of U.S. stocks, for all 10 deciles, at least half of the members in each decile yielded positive returns (i.e., the 2nd quartile “dark grey boxes” are all above the zero-line). Meanwhile, except for the 1st decile, all deciles saw their 3rd quartile returns (i.e., the bottom edge of a “box”) in the negative zone. This pattern suggests the market was bullish overall, yet there was sufficient divergence in stock performance, which led to many companies with negative returns. Moreover, both the 5th and the 10th decile companies saw their average returns reaching 500%, meaning a large number of “extremely small-sized” and “exactly middle-sized” companies did extraordinarily well in the 1990s.
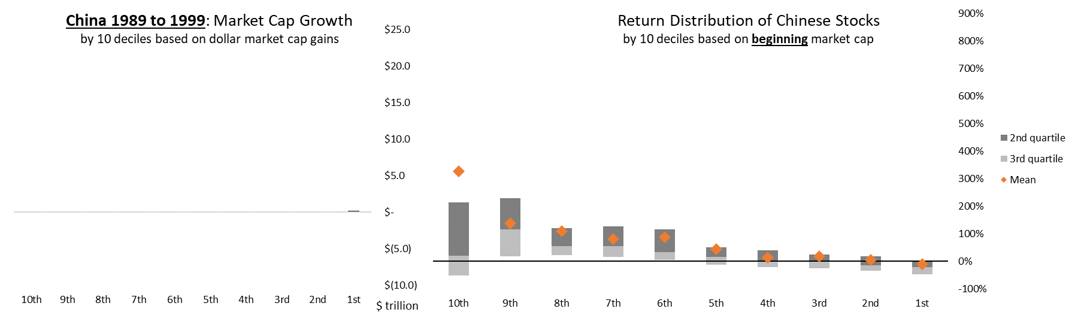
China’s financial markets really only started in the early 1990s: the Shenzhen and Shanghai stock exchanges both launched in 1990; the first H-share, Tsingtao Brewery, listed in Hong Kong in 1993. Companies’ market cap gains were so small that in the left-hand bar chart, the black bars are almost invisible. By the end of the decade, the total market size of all listed Chinese equities only reached $440 billion. Among them, the largest five companies were China Mobile (market cap at $86 billion by 1999), CITIC, Shanghai Pudong Development Bank, Lenovo and Sichuan Changhong Electric.
In terms of Chinese equities’ return distribution, it was a picture of extremes. For the 1st decile companies, their 1st quartile return was negative (measured at -0.29%), meaning at least 75% of the largest Chinese companies lost money during that decade. From the 1st decile to the 4th decile (i.e. the four “boxes” on the right), half of their members lost money. From the 6th decile to the 9th decile, however, at least 75% of their members posted positive returns for the decade (i.e., the entirety of their “boxes” was floating above the zero-line). Regarding the smallest companies, the 10th decile, their mean return approached nearly 350%.
Thoughts for this decade:
- The U.S. stock market displayed sufficient social mobility in the sense that high-performing companies made huge gains and low-performing ones got punished with negative returns. Put differently, during the 1990s, the U.S. stock market was an environment where good companies went up and bad companies went down. What was even more encouraging was the fact that many of the “extremely small-sized” and “exactly middle-sized” companies experienced a decade of strong growth.
- For China, there was so much social mobility in the country’s stock markets that the overall picture looked like a “social revolution” — most large companies went down and most small companies went up. Almost all returns went to small companies. What a violently dynamic market back then!
- Given the dynamisms in both the American and Chinese equity markets, it’s no wonder the 1990s gave birth to many active investing luminaries in both countries.
Decade: 1999 to 2009
Universe captured: ~7,100 listed American companies and ~2,300 listed Chinese companies
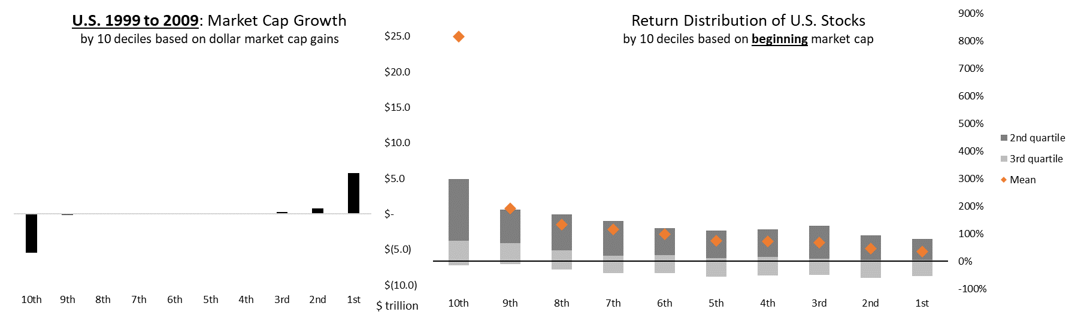

From 1999 to 2009, the U.S. total market cap changed little, starting at $16.5 trillion and ending at $17.8 trillion, an increase of only $1.3 trillion (about 8%). Top decile companies gained $5.8 trillion while bottom decile companies shrank by $5.5 trillion. Winners and losers were reasonably distributed, free of obvious outliers.
Stock return-wise, smaller U.S. companies fared materially better than larger ones. On the one hand, among the smallest companies (i.e. the far-left “box”), their 1st quartile return reached almost 300% and their mean return exceed 800%! On the other hand, among the larger companies, from the 1st decile to the 8th decile, about half of them made money and half did not (i.e. the light grey areas of the “boxes” are mostly under the zero-line).
For China, its equity markets grew from $3.5 trillion to $5.2 trillion, a growth of $1.8 trillion (about 51%), outpacing the U.S.’ growth in both percentage terms and absolute dollar terms. The 1st decile contributed $2.0 trillion and the 10th decile lost $918 billion. Interestingly enough, over 70% of that $918 billion loss came from the $650 billion shrinkage on PetroChina!
China’s return distribution chart inherits some attributes from the previous decade: smaller companies yielded higher returns than larger companies. Here, however, most of the larger companies still posted good results, compared to the large-cap bloodshed seen in the 1990s. What is also noteworthy is that the dispersion of returns (i.e., measured by the height of the “boxes”) appears to have grown wider: wider than itself a decade ago and wider than the U.S. in this same decade.
Thoughts for this decade:
- Company “social mobility” was prevalent in the U.S. stock market in the 2000s: many small companies grew fast; some large companies declined. If you are an active investor, you would love to be in the U.S. and live through the 2000s one more time. Small-cap significantly outperformed large-cap — stock picking worked! Among the larger companies, about half made money and about half lost money — stock picking worked, and short selling worked too!
- China was also a fertile land for active investing. Like in the U.S., small-cap outperformed large-cap. Better than the U.S., the dispersion of stock returns was even wider in China, further enhancing the potential rewards for stock picking and active investing.
Decade: 2009 to 2019
Universe captured: ~6,200 listed American companies and ~5,000 listed Chinese companies
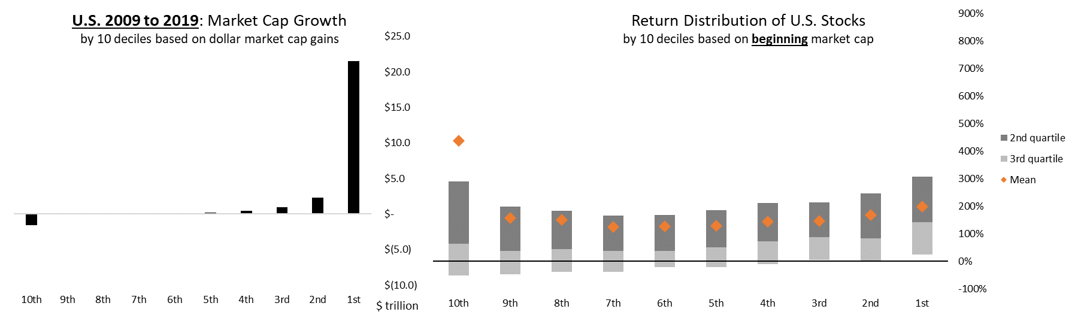
On the U.S. side, the U.S. stock market expanded from $17.0 trillion to $40.9 trillion, a massive gain of $23.9 trillion, which is about equivalent to twice China’s GDP or nine times the U.K.’s GDP. The top two deciles of companies accounted for 100% of all gains. Apple, the biggest winner, saw its market value grow by $1.1 trillion — i.e., one company alone managed to grow by an amount equivalent to 40% of the U.K.’s economy. On the other end of the spectrum, the worst performing American companies were apparently not punished much by the capital market — the bottom decile companies lost only $1.6 trillion of market value, led by Dupont (lost $110 billion), HP (lost $92 billion) and General Electric (lost $64 billion).
In terms of individual stocks’ returns, the 2010s was almost a reverse image of the previous decades. Larger U.S. companies handsomely outstripped the rest. Among the 1st decile largest companies, their 1st quartile return exceeded 300%, far ahead of the 1st quartile returns of the remaining nine deciles. Also, for the 1st decile companies, their 3rd quartile return was the highest among all deciles as well. The largest U.S. companies simply dominated! The only realistic hope to outperform U.S. large-caps appears to be the idea of investing with “100 bagger” penny stocks, as indicated by the smallest stocks’ high-flying average return, which stood at about 430%. (And that is probably why the book 100 Baggers is so popular these days.) The most underperforming groups are those in the middle — the mid-cap companies of the 6th and 7th deciles.
On China side, the total market cap of Chinese equities expanded from $8.6 trillion to $13.0 trillion, a growth of $4.4 trillion. The top four market cap gainers — Tencent, Alibaba, Moutai and Ping An Insurance — contributed $1.1 trillion of gains, about a quarter of the market’s total expansion. The bottom decile saw a meaningful retraction of $1.3 trillion; the biggest loser was PetroChina, shrinking by $207 billion. Again, PetroChina!
From 2009 to 2019, over 50% of the large Chinese companies — those in the 1st to the 5th deciles — posted negative returns (i.e., the light grey areas of the “boxes” are under the zero-line). Smaller companies, except for those in the 10th decile, were able to generate much better results, marked by their heightened 1st quartile and 3rd quartile returns (i.e., the top edges and bottom edges of the “boxes”). These observations support the idea that social mobility is still present in Chinese stock markets. However, compared to previous decades, the dispersion of stock returns (i.e., the height of the “boxes”) has narrowed in this decade, which may indicate a decrease of company “social mobility.”
Thoughts for this decade:
- Social mobility was absent in the U.S. stock market. Small- and middle-sized companies experienced a decade of stagnation. Bigger companies grew significantly faster than smaller ones. Compared to mega-caps, not only did small- and mid-caps post lower returns but also the dispersion of their returns was narrower as well, meaning there were fewer small companies bucking the trends and giving exceptional returns.
- Many active investors in the U.S. must have had a difficult decade. Mega-cap stocks dominated all — so, how much could stock picking give outperformance? Very few companies’ share prices went down, especially among the larger firms — so, how to make money through short selling? Alas! What a double whammy for active investing!
- This story was inverted in China. Index investing has so far not worked in China and it probably is due to the chronic underperformance of large Chinese companies. On the other end of the market cap spectrum, the small- and mid-cap spaces were highly dynamic, providing a strong tailwind for Chinese active investors.
Summary and Thoughts
These charts speak loud and clear. For most of the past three decades, in both the U.S. and China, the stock market did offer a fair amount of “social mobility” for companies and many smaller companies did grow faster than their larger peers. But, for the most recent decade from 2009 to 2019, the U.S. stock market demonstrated a reverse pattern. All the wins were concentrated at the top: Bigger companies keep getting bigger. Middle companies get stuck in the middle. Smaller companies cannot escape the fate of being small.
For Chinese equities, the 1990s was a violent “social revolution” where almost all gains were concentrated at the bottom. That was probably “too much” social mobility there. As the country develops, its stock markets also gradually mature. Today, the Chinese stock market still offers sufficient social mobility — smaller companies continue to outpace larger companies. The very fact that index investing has not worked so far in China can almost be seen as a piece of evidence supporting the idea that active investing still works in China.
As a final thought, the following are a few questions to contemplate further:
- Is the lack of social mobility in the U.S. stock market healthy or unhealthy? Is it an advanced economy’s inescapable fate? Is it a new normal that we must accept? Should we do something? What does this mean for U.S. active investors in the future?
- I am a big believer that there is always a right investment philosophy for a time, not for all times. What will turn out to be the most effective investment philosophy for the upcoming decade, 2019 to 2029?
- Given how difficult active investing has been in the U.S., should investors pay some real attention to active investing in China?
End Note: Methodology and Scope of Data
This study covers all U.S. and Chinese companies that were listed at any time during the past three decades, spanning from 1989 to 2019.
On the U.S. side, my data includes all American companies listed on U.S. exchanges from 1979 to 2019. Companies listed on Pink Sheets and other OTC-like venues are not included. On the China side, my data includes all public Chinese companies regardless of their listing venues; the venues are most often Shanghai, Shenzhen, Hong Kong and U.S. ADR markets. Delisted companies are also included in this study, to the degree I was able to recover their data.
Some quick technical notes:
- All figures are in U.S. dollars.
- Stock returns include dividends.
- Multi-class and multi-listing are “deduplicated” to avoid counting the same company twice.
- If a company delisted during a decade, its market cap changes are still included in the study for that decade.
- Stock market cap gains are measured since a company’s IPO date, thus excluding the amount of capital raised from the company’s IPO.
In total, this study covers about 15,900 listed American companies and about 5,500 listed Chinese companies.
(END)
