
My wife and I decided not to go anywhere on New Year’s Day. Instead, we spent the day at home. Bored, I decided to devote my first day of this new decade to examining something interesting of the past decade. One of the most distinctive features of the 2010s was America’s roaring stock market, which now is the longest bull market in history. Including dividends, $1 invested in the S&P 500 Index — a basket of some 500 companies — has turned into $3.6, a whopping 13.6% annualized rate of return. The stunning performance of America’s stock market invites the arrival of a very logical conclusion: over the past decade, American companies and people have fared well.
However, this rosy image does not square with reality. For the 19 years from 1999 to 2018, real median household income in the U.S. has only grown at 0.14% a year; from 2007 to 2018, the pace was only 0.32% a year.
To reconcile the two pictures, it is sensible to re-examine the 2010s with a goal to truly understand what has happened in the stock market. The study needs to be both broader and deeper than “the S&P 500 Index” — broader in the sense that it should cover more than 500 companies, ideally the entire population of listed American companies, and deeper in the sense that the study should offer a bottom-up view of individual companies with detailed texture.
But, is there an indicator that has economic intuition, that is related to the roaring stock market and that is easily measurable on all listed companies?
Market Capitalization! (i.e. a company’s market value)
Market capitalization is measurable and unambiguous — it measures the size of a company. And by measuring changes in market capitalization, we can tell whether a company is growing or not. We can also tell which companies have been growing the fastest and which companies have been shrinking.
The Decade from 2010 to 2019 & Expected Even Distribution of Growth
Over the past 10 years, about 4,600 American companies have been floating on the country’s stock exchanges at some point (a combination of active and de-listed companies). Over a decade’s time, these companies have in aggregate grown by $22.1 trillion and this growth in market capitalization has lifted the U.S. stock market to a valuation of $34.8 trillion by the end of 2019.
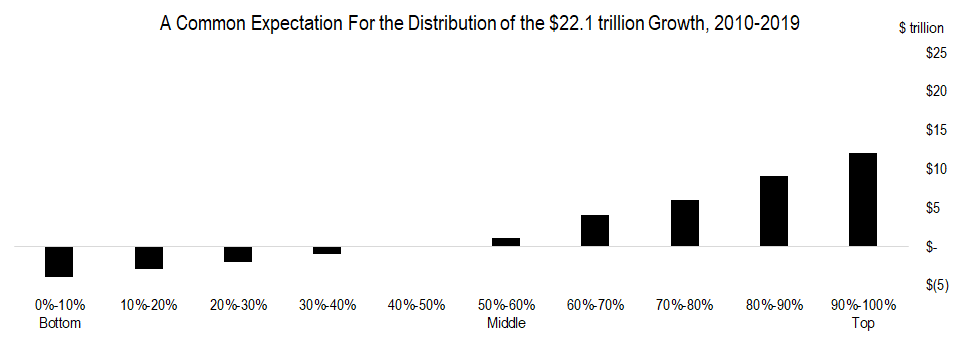
A common expectation is that this $22.1 trillion of new gains ought to be relatively evenly distributed. If we distribute companies based on their growth in market capitalization so the top 10% are companies that have grown their market capitalization the most, then we would expect that the top 10% of companies grew by a lot; good companies in the middle also grew handsomely; bad companies got disciplined and lost some of their value; some really bad companies in the bottom 10% were severely punished and lost a lot. That is just how a healthy financial market works.
So, this expectation would lead us to a picture that roughly looks like this:
The Decade From 2010 to 2019 — The Reality
Reality seldom matches expectations, but it is the gap between the two that matters.

As the above chart demonstrates, over the course of the past 10 years and among the 4,600 listed American companies, the top 10% of companies grew by $19.9 trillion, representing over 90% of the $22.1 trillion of total growth. The next 10% of companies (i.e. 80% to 90%) grew by $2.2 trillion, representing slightly under 10% of the total growth; the next 10% of companies grew only by $0.93 trillion.
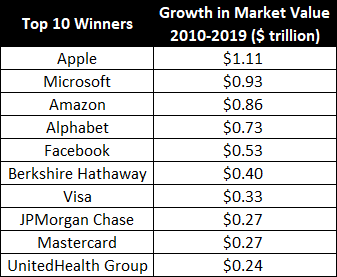
Counting the top 10 companies that grew their market capitalization the most, all top five winners were technology companies. Berkshire Hathaway came at No.6.

What is even more shocking is this: the top 1% of companies (just 47 companies) grew by $10.2 trillion, which is 4.6x the bottom 90% of companies combined (about 4,100 companies)!
Given the entire U.S. stock market only grew by $22.1 trillion over the past decade, the growth from the top 1% of the companies accounted for almost half of this growth.
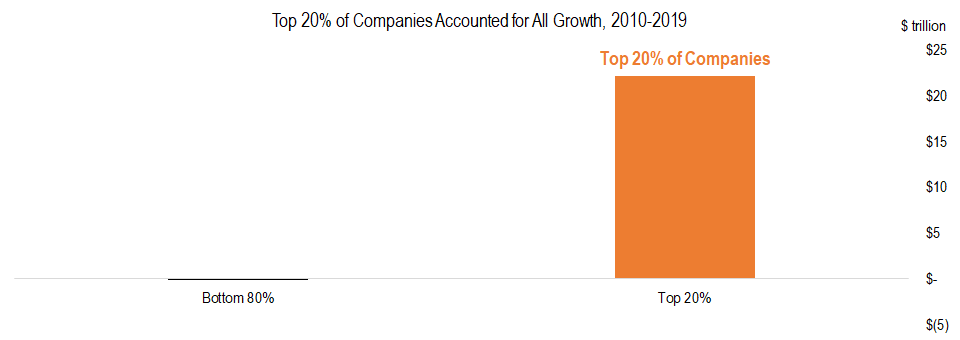
From an 80/20 split point of view, the bottom 80% of the companies have added almost no value at all (they actually lost $0.0075 trillion) while all the $22.1 trillion growth went to the top 20% of companies.
A Decade of Inequality
Perhaps, stock markets are no longer a barometer for the economic health of a country. The top 1% of companies dominate the bottom 90% by a ratio of 4.6-to-1. The bottom 80% of companies remained stale for 10 years. Perhaps, something is wrong.
One way to think about this is through a labor angle. In total, the top 1% of companies employ 8.7 million people, which is less than 5% of America’s total working age population (about 200 million). If a person was employed by the top 1% of companies (or even the top 20%), he or she probably has done well this past decade. If a person was with the bottom 80% of companies, on average, his or her company has not grown at all and it is reasonable to believe that his or her salary has not changed much either. And, that is probably one of the driving forces leading to the stagnation of real median household income for the past decade.
The heightened wealth inequality in the society has already split us into the “haves” and the “have nots” and has created a myriad of difficult social and political problems. I believe this study shows that “companies” are also bifurcating into the “haves” and the “have nots.” And we should get ready to deal with the challenges this heightened level of “corporate inequality” can bring upon us.
Has the Booming Stock Market Benefited All?
Afterthoughts
- Inequality: if you have not watched it yet, you should — this YouTube video (link) has earned 22 million views.
- Technology: is technology the “culprit” to blame? Technology usually leads to network effects, which then leads to a business dynamic of winners-take-all. Is there is a downside to what technology is bringing to us, what is it and how do we manage it?
- Bad companies: the bottom 10% companies only lost $1.5 trillion of market value, which was way less than the common expectation. Is the capital market still functioning properly by not only rewarding the good players but also punishing the bad actors?
- Investing: since the only obvious winners are the big and growthy companies, is Index Investing (i.e. buying S&P 500 ETF) the only obvious way toward investment success? Or alternatively, because (apparently) fewer smaller listed companies have succeeded in a big way, does it make active investing/stock picking more needed and appealing than ever before?
(END)
References:
The S&P United States BMI Index was used as a proxy for the entire U.S. stock market. Foreign-listed American companies are excluded; for multi-share companies, such as Google, only one ticker is represented in the study.
Listed companies’ employee headcounts come from official company filings.

[…] previous piece A Decade of Inequality focused on the concept of “market cap gains.” It reviewed the end results but paid little […]
LikeLike